Our latest data indicates that best-in-class workspaces achieved prices up to 51% above the global market average in Q1 2024.
As the flexible workspace market becomes more fluid, areas of opportunity are emerging for providers of flexible workspace to increase revenues and improve margins, but they need to know where to look.
Across the flex sector, office providers are experiencing downward pressure on prices, but there are still pockets where prices are growing. In particular, premium quality workspaces are seeing an uptick in pricing across the global office market.
With variations in the market, office providers must use data and insights to adjust pricing strategies based on market dynamics if they want to maximize their return on investment.
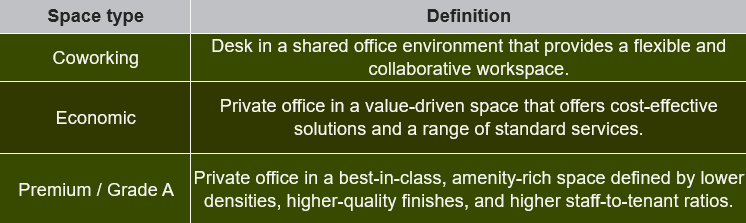
Definitions of space types
There's not one-size-fits-all for flex. Beyond the range of products and services people want from flex, there are also a range of characteristics that define them. Below is an overview of how we define the variety of spaces we track.
Supply and demand imbalance
The growing demand for Grade A, top-tier office spaces, combined with limited supply, is causing a significant rise in prices at the premium end of the market.
Affordable, value-based workspaces still have their place, but they are feeling increased pressure to fill their vacant spaces, leading to lower price increases in an attempt to attract more tenants and boost revenue.
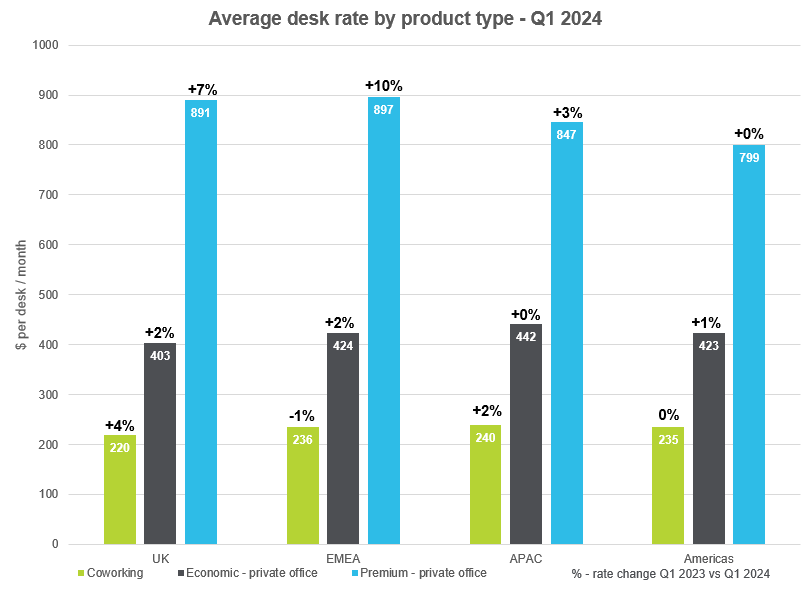
Premium spaces are characterised by lower densities, higher-quality finishes, and high staff-to-tenant ratios.
These spaces have seen prices increase +10% from Q1 2023 to Q1 2024 in EMEA, +7% in the UK, +3% in APAC, and have remained stable in the Americas.
Prices within economic spaces, on the other hand, have seen little to no increase across all markets throughout the same period.
Understanding a fluid landscape
Although rates have remained relatively flat in the Americas as a whole, there are significant variations at a city level, with Grade A spaces in Mexico City seeing a phenomenal 46% uplift due to increased demand and those in New York City a 13% increase, while Grade A spaces in Atlanta and Austin have declined.
City-level variations are not only evident within the Americas but across all global regions, making reliable data critical to ensure investment is made in the right locations and pricing strategies are adjusted accordingly.
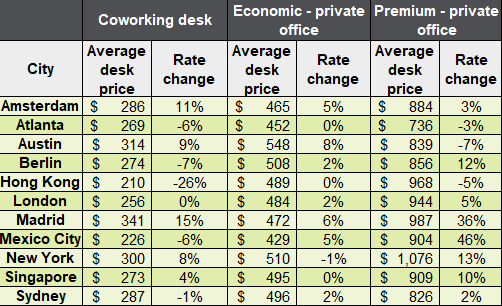
Within EMEA, Madrid (+36%) and Berlin (+12%) are outpacing the more mature market of London where premium rates have seen a mere 5% increase (Q1 2023 – Q1 2024).
For office providers, this level of detailed data on city and property trends helps ensure investments are made in the best locations for maximum returns. Providers in areas with rising rates can confidently increase their prices to match market demand.
___________________________
Methodology
Data within the report is compiled from The Instant Group’s proprietary data.